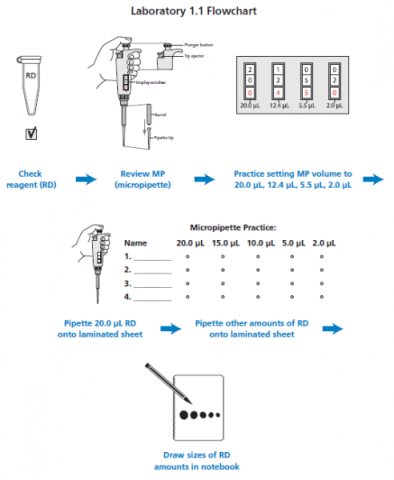
What are “flowcharts”?
Flowcharts are a common type of graphic organizer; they can help students to organize their thinking and their ideas in a visual way. They often combine a series of diagrams with short summaries, all arranged in a specific order.
Why use flowcharts?
Flowcharts are an especially useful tool for keeping track of step-by-step processes, making them ideal for use in a lab setting. Seeing a process represented visually can aid students in finding patterns and in making connections with previous knowledge. Because making a flowchart requires some degree of condensation and simplification, students are required to determine which pieces of information are most important. Some studies have also found that when used in combination with a text, flowcharts greatly increase students’ reading comprehension. This makes them an excellent tool to support both students who struggle with reading and those who are learning in a non-native language. In this age of remote or hybrid learning, flowcharts can also be used to supplement lab demonstrations or simulations.
Suggestions for using flowcharts with students:
Numerous ABE teachers have experimented with using flowcharts in their classes, and have suggested trying any/or all of the following:
- Students create their own flowchart after previewing the lab procedure
- Students collaborate to create a flowchart after previewing the lab procedure
- Students annotate an existing flowchart with a summary of what is occurring in each step pictured
- Students refer to the flowchart while performing the lab and check off each step as they go
View this series of blank flowcharts for the Full Lab Sequence developed by the ABE Program Office.
How have you used flowcharts or other visual learning materials in the lab? Share what you’re doing by tweeting to @ABEProgOffice!